Programming, graphics, games, media, C++, Windows, Internet and more...
Entries for tag "optimization", ordered from most recent. Entry count: 12.
Pages: 1 2 ![]()
# A Metric for Memory Fragmentation
Wed
06
Apr 2022
In this article, I would like to discuss the problem of memory fragmentation and propose a formula for calculating a metric telling how badly the memory is fragmented.
The problem can be stated like this:
So it is a standard memory allocation situation. Now, I will explain what do I mean by fragmentation. Fragmentation, for this article, is an unwanted situation where free memory is spread across many small regions in between allocations, as opposed to a single large one. We want to measure it and preferably avoid it because:
VirtualAlloc) and sub-allocating them for the user's allocation requests, high fragmentation my require allocating another block to satisfy the request, making the program using more system memory than really needed.A solution to this problem is to perform defragmentation - an operation that moves the allocations to arrange them next to each other. This may require user involvement, as pointers to the allocations will change then. It may also be a time-consuming operation to calculate better places for the allocations and then to copy all their data. It is thus desirable to measure the fragmentation to decide when to perform the defragmentation operation.
Comments | #gpu #algorithms #optimization Share
# Understanding Graphs in GPUView and RGP
Tue
30
Nov 2021
When optimizing performance of a game or some other program, the most important thing is to get hard data first – to profile it using some tools, to see what is happening and where to focus attention. There are many profiling tools available. When talking about graphics, we realize that GPU is really a co-processor that can execute submitted work at its own pace, therefore GPU profiling tools offer a specific type of graph to visualize it. In this article, I will explain how to read this type of graph.
Let's take Radeon GPU Profiler (RGP) as an example. This program is available for free and is compatible with AMD graphics cards. It can capture data from programs that use Direct3D 12 or Vulkan. When we open a capture file and go to Overview > Frame summary tab, we can see a graph like this one:

It may look scary at first glance, but don't worry and stay with me. I will explain everything step-by-step. I don't know if there is any name for this type of graph, so let's call it a "queue graph" because it shows a queue of tasks submitted to the graphics card and executed by it.
The horizontal axis is time, passing in the right direction at a constant pace. The vertical axis is the queue, with the front of the queue on the bottom and items enqueued later stacked on top.

At each point in time, the item on the bottom row is the one currently executing on the GPU. Everything above this row is waiting for its turn. It means that from the graph we can see and measure when a certain piece of work (like D3D12 ExecuteCommandLists call in this example) was enqueued, when it started executing. and how long it took to execute it. The width of the bottom block represents the amount of time that was required to execute. Note that the work item going “down the stairs” has no meaning in itself. It just means something in front of it finished, so the queue ahead is shorter. Only when it ends up in the bottom row, it really starts executing.

Another thing to note is that some items wait in the queue but don't take any significant time to execute. These are simple and quick commands, like the green call to the Signal function marked here. When everything in front of it completes, it also completes in no time.

We can make more observations from this graph if we consider the fact that games work with frames, each frame executes commands to draw the whole image from clearing background through 3D objects to UI and finishes with a call to the Present function, marked here in brown color. By looking for this type of item, we can conclude when a new frame begins. For example, in the point "A" the GPU is still executing commands of frame N, while we have all commands for the next frame N+1 enqueued, including its next Present, and also the commands for frame N+2 are stacking up at the end of the queue. Thus, we can expect the game to have 2 frames of latency in displaying the image.

The same type of graph is used by GPUView - a free tool from Microsoft that can record and display what is happening in the system on a very low level. (The linked article is very old - right now the way to install the tool is to grab Windows Assessment and Deployment Kit (Windows ADK) and a convenient UI for it is UIforETW). As you can see here, both "3D Hardware Queue" of my graphics card and software "Device Context" of a running game show packets of work submitted for rendering.

One important piece of information that we can extract from this graph is that GPU is not busy 100% of the time. GPUView actually shows the number on the right, which is 77.89% for the current view. It means the game is not GPU-bound. Reducing graphics quality settings would not increase framerate (FPS). This often happens when the game does some heavy computations on the CPU or when it reaches 60 FPS and we have V-sync enabled. Here we have the latter case, as we can see moments of vertical synchronization marked as blue lines, while rendering each frame seems to be blocked until that moment.
Note the graph described here is not the same as flame graphs or flame charts, which show a hierarchy of nested things, not a queue. For example, a call stack of function calls.
Comments | #optimization #tools Share
# Creative Use of GPU Fixed-Function Hardware
Wed
22
Sep 2021
I recently broke my rule of posting on my blog at least once a month as I had some other topics and problems to handle in my life, but I'm still alive, still doing graphics programming for a living, so I hope to get back to blogging now. This post is more like a question rather than an answer. It is about creative use of GPU fixed-function hardware. Warning: It may be pretty difficult for beginners, full of graphics programming terms you should already know to understand it. But first, here is some background:
I remember the times when graphics cards were only configurable, not programmable. There were no shaders, only a set of parameters that could control pre-defined operations - transform of vertices, texturing and lighting of pixels. Then, shaders appeared. They evolved by supporting more instructions to be executed and a wider variety of instructions available. At some point, even before the invention of compute shaders, the term “general-purpose computing on GPU” (GPGPU) appeared. Developers started encoding some data as RGBA colors of texture pixels and drawing full-screen quads just to launch calculation of some non-graphical tasks, implemented as pixel shaders. Soon after, compute shaders appeared, so they no longer need to pretend anything - they can now spawn a set of threads that can just read and write memory freely through Direct3D unordered access views aka Vulkan storage images and buffers.
GPUs seem to become more universal over time, with more and more workloads done as compute shaders these days. Will we end up with some generic, highly parallel compute machines with no fixed-function hardware? I don’t know. But Nanite technology from the new Unreal Engine 5 makes a step in this direction by implementing its own rasterizer for some of its triangles, in form of a compute shader. I recommend a good article about it: “A Macro View of Nanite – The Code Corsair” (it seems the link is broken already - here is a copy on Wayback Machine Internet Archive). Apparently, for tiny triangles of around single pixel size, custom rasterization is faster than what GPUs provide by default.
But in the same article we can read that Epic also does something opposite in Nanite: they use some fixed-function parts of the graphics pipeline very creatively. When applying materials in screen space, they render a full-screen pass per each material, but instead of drawing just a full-screen triangle, they do a regular triangle grid with quads covering tiles of NxN pixels. They then perform a coarse-grained culling of these tiles in a vertex shader. In order to reject one, they output vertex position = NaN, which makes a triangle incorrect and not spawning any pixels. Then, a more fine-grained culling is performed using Z-test. Per-pixel material identifier is encoded as depth in a depth buffer! This can be fast, as modern GPUs apply “HiZ” - an internal optimization to reject whole groups of pixels that fail Z-test even before their pixel shaders are launched.
This reminded me of another creative use of the graphics pipeline I observed in one game a few years ago. That pass was calculating luminance histogram of a scene. They also rendered a regular grid of geometry in screen space, but with “point list” topology. Each vertex was sampling and calculating average luminance of its region. On the other end, the histogram texture of Nx1 pixels was bound as a render target. Measured luminance of a region was returned as vertex position, while incrementation of the specific place on the histogram was ensured using additive blending. I suspect this is not the most optimal way of doing this, a compute shader using atomics could probably do it faster, but it surely was very creative and took me some time to figure out what that pass is really doing and how is it doing it.
After all, GPUs have many fixed-function elements next to their shader cores. Vertex fetch, texture sampling (with mip level calculation, trilinear and anisotropic filtering), tessellation, rasterization, blending, all kinds of primitive culling and pixel testing, even vertex homogeneous divide... Although not included in the calculation of TFLOPS power, these are real transistors with compute capabilities, just very specialized. Do you know any other smart, creative uses of them?
Comments | #rendering #optimization #gpu Share
# A Better Way to Scalarize a Shader
Tue
20
Oct 2020
This will be an advanced article. It assumes you not only know how to write shaders but also how they work on a low level (like vector versus scalar registers) and how to optimize them using scalarization. It all starts from a need to index into an array of texture or buffer descriptors, where the index is dynamic – it may vary from pixel to pixel. This is useful e.g. when doing bindless-style rendering or blending various layers of textures e.g. on a terrain. To make it working properly in a HLSL shader, you need to surround the indexing operation with a pseudo-function NonUniformResourceIndex. See also my old blog post “Direct3D 12 - Watch out for non-uniform resource index!”.
Texture2D g_Textures[] : register(t1);
...
return g_Textures[NonUniformResourceIndex(textureIndex)].Load(pos);
In many cases, it is enough. The driver will do its magic to make things working properly. But if your logic dependent on textureIndex is more complex than a single Load or SampleGrad, e.g. you sample multiple textures or do some calculations (let's call it MyDynamicTextureIndexing), then it might be beneficial to scalarize the shader manually using a loop and wave functions from HLSL Shader Model 6.0, sometimes also called a "peeling loop".
I learned how to do scalarization from the 2-part article “Intro to GPU Scalarization” by Francesco Cifariello Ciardi and the presentation “Improved Culling for Tiled and Clustered Rendering” by Michał Drobot, linked from it. Both sources propose an implementation like the following HLSL snippet:
// WORKING, TRADITIONAL
float4 color = float4(0.0, 0.0, 0.0, 0.0);
uint currThreadIndex = WaveGetLaneIndex();
uint2 currThreadMask = uint2(
    currThreadIndex < 32 ? 1u << currThreadIndex : 0,
    currThreadIndex < 32 ? 0 : 1u << (currThreadIndex - 32));
uint2 activeThreadsMask = WaveActiveBallot(true).xy;
while(any(currThreadMask & activeThreadsMask) != 0)
{
    uint scalarTextureIndex = WaveReadLaneFirst(textureIndex);
    uint2 scalarTextureIndexThreadMask = WaveActiveBallot(scalarTextureIndex == textureIndex).xy;
    activeThreadsMask &= ~scalarTextureIndexThreadMask;
    [branch]
    if(scalarTextureIndex == textureIndex)
    {
        color = MyDynamicTextureIndexing(textureIndex);
    }
}
return color;
It involves a bit mask of active threads. From the moment I first saw this code, I started wondering: Why is it needed? A mask of threads that still want to continue spinning the loop is already maintained implicitly by the shader compiler. Couldn't we just break; from the loop when done with the textureIndex of the current thread?! So I wrote this short piece of code:
// BAD, CRASHES
float4 color = float4(0.0, 0.0, 0.0, 0.0);
while(true)
{
    uint scalarTextureIndex = WaveReadLaneFirst(textureIndex);
    [branch]
    if(scalarTextureIndex == textureIndex)
    {
        color = MyDynamicTextureIndexing(textureIndex);
        break;
    }
}
return color;
…and it crashed my GPU. At first I thought it may be a bug in the shader compiler, but then I recalled footnote [2] in part 2 of the scalarization tutorial, which mentions an issue with helper lanes. Let me elaborate on this. When a shader is executed in SIMT fashion, individual threads (lanes) may be active or inactive. Active lanes are these that do their job. Inactive lanes may be inactive from the very beginning because we are at the edge of a triangle so there are not enough pixels to make use of all the lanes or may be disabled temporarily because e.g. we are executing an if section that some threads didn't want to enter. But in pixel shaders there is a third kind of lanes – helper lanes. These are used instead of inactive lanes to make sure full 2x2 quads always execute the code, which is needed to calculate derivatives ddx/ddy, also done explicitly when sampling a texture to calculate the correct mip level. A helper lane executes the code (like an active lane), but doesn't export its result to the render target (like an inactive lane).
As it turns out, helper lanes also don't contribute to wave functions – they work like inactive lanes. Can you already see the problem here? In the loop shown above, it may happen than a helper lane has its textureIndex different from any active lanes within a wave. It will then never get its turn to process it in a scalar fashion, so it will fall into an infinite loop, causing GPU crash (TDR)!
Then I thought: What if I disable helper lanes just once, before the whole loop? So I came up with the following shader. It seems to work fine. I also think it is better than the first solution, as it operates on the thread bit mask only once at the beginning and so uses fewer variables to be stored in GPU registers and does fewer calculations in every loop iteration. Now I'm thinking whether there is something wrong with my idea that I can't see now? Or did I just invent a better way to scalarize shaders?
// WORKING, NEW
float4 color = float4(0.0, 0.0, 0.0, 0.0);
uint currThreadIndex = WaveGetLaneIndex();
uint2 currThreadMask = uint2(
    currThreadIndex < 32 ? 1u << currThreadIndex : 0,
    currThreadIndex < 32 ? 0 : 1u << (currThreadIndex - 32));
uint2 activeThreadsMask = WaveActiveBallot(true).xy;
[branch]
if(any((currThreadMask & activeThreadsMask) != 0))
{
    while(true)
    {
        uint scalarTextureIndex = WaveReadLaneFirst(textureIndex);
        [branch]
        if(scalarTextureIndex == textureIndex)
        {
            color = MyDynamicTextureIndexing(textureIndex);
            break;
        }
    }
}
return color;
UPDATE 2020-10-28: There are some valuable comments under my tweet about this topic that I recommend to check out.
UPDATE 2021-12-03: As my colleague pointed out today, the code I showed above as "BAD" is perfectly fine for compute shaders. Only in pixel shaders we have problems with helper lanes. Thank you Steffen!
Comments | #gpu #optimization #directx Share
# Which Values Are Scalar in a Shader?
Wed
14
Oct 2020
GPUs are highly parallel processors. Within one draw call or a compute dispatch there might be thousands or millions of invocations of your shader. Some variables in such a shader have constant value for all invocations in the draw call / dispatch. We can call them constant or uniform. A literal constant like 23.0 is surely such a value and so is a variable read from a constant (uniform) buffer, let’s call it cbScaleFactor, or any calculation on such data, like (cbScaleFactor.x + cbScaleFactor.y) * 2.0 - 1.0.
Other values may vary from thread to thread. These will surely be vertex attributes, as well as system value semantics like SV_Position in a pixel shader (denoting the position of the current pixel on the screen), SV_GroupThreadID in a compute shader (identifier of the current thread within a thread group), and any calculations based on them. For example, sampling a texture using non-constant UV coordinates will result in a non-constant color value.
But there is another level of grouping of threads. GPU cores (Compute Units, Execution Units, CUDA Cores, however we call them) execute a number of threads at once in a SIMD fashion. It would be more correctly to say SIMT. For the explanation of the difference see my old post: “How Do Graphics Cards Execute Vector Instructions?” It’s usually something like 8, 16, 32, 64 threads executing on one core, together called a wave in HLSL and a subgroup in GLSL.
 Normally you don’t need to care about this fact. However, recent versions of HLSL and GLSL added intrinsic functions that allow to exchange data between lanes (threads/invocations within a wave/subgroup) - see “HLSL Shader Model 6.0” or “Vulkan Subgroup Tutorial”. Using them may allow to optimize shader performance.
This another level of grouping yields a possibility for a variable to be or not to be uniform (to have the same value) across a single wave, even if it’s not constant across the entire draw call or dispatch. We can also call it scalar, as it tends to go to scalar registers (SGPRs) rather than vector registers (VGPRs) on AMD architecture, which is overall good for performance. Simple cases like the ones I mentioned above still apply. What’s constant across the entire draw call is also scalar within a wave. What varies from thread to thread is not scalar. Some wave functions like WaveReadLaneFirst, WaveActiveMax, WaveActiveAllTrue return the same value for all threads, so it’s always scalar.
Knowing which values are scalar and which ones may not be is necessary in some cases. For example, indexing buffer or texture array requires special keyword NonUniformResourceIndex if the index is not uniform across the wave. I warned about it in my blog post “Direct3D 12 - Watch out for non-uniform resource index!”. Back then I was working on shader compiler at Intel, helping to finish DX12 implementation before the release of Windows 10. Now, 5 years later, it is still a tricky thing to get right.
Another such case is a function WaveReadLaneAt which “returns the value of the expression for the given lane index within the specified wave”. The index of the lane to fetch was required to be scalar, but developers discovered it actually works fine to use a dynamically varying value for it, like Ken Hu in his blog post “HLSL pitfalls”. Now Microsoft formally admitted that it is working and allowed LaneIndex to be any value by making this GitHub commit to their documentation.
If this is so important to know where an argument needs to be scalar and which values are scalar, you should also know about some less obvious, tricky ones.
SV_GroupID in compute shader – identifier of the group within a compute dispatch. This one surely is uniform across the wave. I didn’t search specifications for this topic, but it seems obvious that if a groupshared memory is private to a thread group and a synchronization barrier can be issued across a thread group, threads from different groups cannot be assigned to a single wave. Otherwise everything would break.
SV_InstanceID in vertex shader – index of an instance within an instanced draw call. It looks similar, but the answer is actually opposite. I’ve seen discussions about it many times. It is not guaranteed anywhere that threads in one wave will calculate vertices of the same instance. While inconvenient for those who would like to optimize their vertex shader using wave functions, it actually gives a graphics driver an opportunity to increase utilization by packing vertices from multiple instances into one wave.
SV_GroupThreadID.xyz in compute shader – identifier of the thread within a thread group in a particular dimension. Article “Porting Detroit: Become Human from PlayStation® 4 to PC – Part 2” on GPUOpen.com suggests that by using [numthreads(64,2,1)], you can be sure that waves will be dispatched as 32x1x1 or 64x1x1, so that SV_GroupThreadID.y will be scalar across a wave. It may be true for AMD architecture and other GPUs currently on the market, so relying on this may be a good optimization opportunity on consoles with a known fixed hardware, but it is not formally correct to assume this on any PC. Neither D3D nor Vulkan specification says that threads from a compute thread group are assigned to waves in row-major order. The order is undefined, so theoretically a driver in a new version may decide to spawn waves of 16x2x1. It is also not guaranteed that some mysterious new GPU couldn’t appear in the future that is 128-lane wide. WaveGetLaneCount function says “the result will be between 4 and 128”. Such GPU would execute entire 64x2x1 group as a single wave. In both cases, SV_GroupThreadID.y wouldn’t be scalar.
Long story short: Unless you can prove otherwise, always assume that what is not uniform (constant) across the entire draw call or dispatch is also not uniform (scalar) across the wave.
Comments | #gpu #directx #vulkan #optimization Share
# Thoughts on graphics APIs and libraries
Thu
07
Feb 2019
Warning: This is a long rant. I’d like to share my personal thoughts and opinions on graphics APIs like Vulkan, Direct3D 12.
Some time ago I came up with a diagram showing how the graphics software technologies evolved over last decades – see my blog post “Lower-Level Graphics API - What Does It Mean?”. The new graphics APIs (Direct3D 12, Vulkan, Metal) are not only a clean start, so they abandon all the legacy garbage going back to ‘90s (like glVertex), but they also take graphics programming to a new level. It is a lower level – they are more explicit, closer to the hardware, and better match how modern GPUs work. At least that’s the idea. It means simpler, more efficient, and less error-prone drivers. But they don’t make the game or engine programming simpler. Quite the opposite – more responsibilities are now moved to engine developers (e.g. memory management/allocation). Overall, it is commonly considered a good thing though, because the engine has higher-level knowledge of its use cases (e.g. which textures are critically important and which can be unloaded when GPU memory is full), so it can get better performance by doing it properly. All this is hidden in the engines anyway, so developers making their games don’t notice the difference.
Those of you, who – just like me – deal with those low-level graphics APIs in their everyday work, may wonder if these APIs provide the right level of abstraction. I know it will sound controversial, but sometimes I get a feeling they are at the exactly worst possible level – so low they are difficult to learn and use properly, while so high they still hide some implementation details important for getting a good performance. Let’s take image/texture barriers as an example. They were non-existent in previous APIs. Now we have to do them, which is a major pain point when porting old code to a new API. Do too few of them and you get graphical corruptions on some GPUs and not on the others. Do too many and your performance can be worse than it has been on DX11 or OGL. At the same time, they are an abstract concept that still hides multiple things happening under the hood. You can never be sure which barrier will flush some caches, stall the whole graphics pipeline, or convert your texture between internal compression formats on a specific GPU, unless you use some specialized, vendor-specific profiling tool, like Radeon GPU Profiler (RGP).
It’s the same with memory. In DX11 you could just specify intended resource usage (D3D11_USAGE_IMMUTABLE, D3D11_USAGE_DYNAMIC) and the driver chose preferred place for it. In Vulkan you have to query for memory heaps available on the current GPU and explicitly choose the one you decide best for your resource, based on low-level flags like VK_MEMORY_PROPERTY_DEVICE_LOCAL_BIT, VK_MEMORY_PROPERTY_HOST_VISIBLE_BIT etc. AMD exposes 4 memory types and 3 memory heaps. Nvidia has 11 types and 2 heaps. Intel integrated graphics exposes just 1 heap and 2 types, showing the memory is really unified, while AMD APU, also integrated, has same memory model as the discrete card. If you try to match these to what you know about physically existing video RAM and system RAM, it doesn’t make any sense. You could just pick the first DEVICE_LOCAL memory for the fastest GPU access, but even then, you cannot be sure your resource will stay in video RAM. It may be silently migrated to system RAM without your knowledge and consent (e.g. if you go out of memory), which will degrade performance. What is more, there is no way to query for the amount of free GPU memory in Vulkan, unless you do hacks like using DXGI.
Hardware queues are no better. Vulkan claims to give explicit access to the pieces of GPU hardware, so you need to query for queues that are available. For example, Intel exposes only a single graphics queue. AMD lets you create up to 3 additional compute-only queues and 2 transfer queues. Nvidia has 8 compute queues and 1 transfer queue. Do they all really map to silicon that can work in parallel? I doubt it. So how many of them to use to get the best performance? There is no way to tell by just using Vulkan API. AMD promotes doing compute work in parallel with 3D rendering while Nvidia diplomatically advises to be “conscious” with it.
It's the same with presentation modes. You have to enumerate VkPresentModeKHR-s available on the machine and choose the right one, along with number of images in the swapchain. These don't map intuitively to a typical user-facing setting of V-sync = on/off, as they are intended to be low level. Still you have no control and no way to check whether the driver does "blit" or "flip".
One could say the new APIs don’t deliver to their promise of being low level, explicit, and having predictable performance. It is impossible to deliver, unless the API is specific to one GPU, like there is on consoles. A common API over different GPUs is always high level, things happen under the hood, and there are still fast and slow paths. Isn’t all this complexity just for nothing? It may be true that comparing to previous generation APIs, drivers for the new ones need not launch additional threads in the background or perform shader compilation on first draw call, which greatly reduces chances of major hitching. (We will see how long this state will persist as the APIs and drivers evolve.) * Still there is no way to predict or ensure minimum FPS/maximum frame time. We are talking about systems where multiple processes compete for resources. On modern PCs there is even no way to know how many cycles will a single instruction take! Cache memory, branch prediction, out-of-order execution – all of these mechanisms are there in the CPU to speed up average cases, but there can always be cases when it works slowly (e.g. cache miss). It’s the same with graphics. I think we should abandon the false hope of predictable performance as a thing of the past, just like rendering graphics pixel-perfect. We can optimize for the average, but we cannot ensure the minimum. After all, games are “soft real-time systems”.
Based on that, I am thinking if there is a room for a new graphics API or top of DX12 or Vulkan. I don’t mean whole game engine with physical simulation, handling sound, input controllers and all, like Unity or UE4. I mean an API just like DX11 or OGL, on a similar or higher abstraction level (if higher level, maybe the concept of persistent “frame graph” with explicit pass and resource dependencies is the way to go?). I also don’t think it’s enough to just reimplement any of those old APIs. The new one should take advantage of features of the explicit APIs (like parallel command buffer recording), while hiding the difficult parts (e.g. queues, memory types, descriptors, barriers), so it’s easier to use and harder to misuse. (An existing library similar to this concept is V-EZ from AMD.) I think it may still have good performance. The key thing needed for creation of such library is abandoning the assumption that developer must define everything up-front, with nothing allocated, created, or transferred on first use.
See also next post: "How to design API of a library for Vulkan?"
Update 2019-02-12: I want to thank all of you for the amazing feedback I received after publishing this post, especially on Twitter. Many projects have been mentioned that try to provide an API better than Vulkan or DX12 - e.g. Apple Metal, WebGPU, The Forge by Confetti.
* Update 2019-04-16: Microsoft just announced they are adding background shader optimizations to D3D12, so driver can recompile and optimize shaders in the background on its own threads. Congratulations! We are back at D3D11 :P
Update 2021-04-01: Same with pipeline states. In the old days, settings used to be independent, enabled using glEnable or ID3D9Device::SetRenderState. New APIs promised to avoid "non-orthogonal states" - having to recompile shaders on a new draw call (which caused a major hitch) by enclosing most of the states in a Pipeline (State Object). But they went too far and require a new PSO every time we want to change something simple which almost certainly doesn't go to shader code, like stencil write mask. That created new class of problems - having to create thousands of PSOs during loading (which can take minutes), necessity for shader caches, pipeline caches etc. Vulkan loosened these restrictions by offering "dynamic state" and later extended that with VK_EXT_extended_dynamic_state extension. So we are back, with just more complex API to handle :P
Comments | #gpu #optimization #graphics #directx #libraries #vulkan Share
# Efficient way of using std::vector
Sat
22
Sep 2018
Some people say that C++ STL is slow. I would rather say it's the way we use it. Sure, there are many potential sources of slowness when using STL. For example, std::list or std::map tends to allocate many small objects and dynamic allocation is a time-consuming operation. Making many copies of your objects like std::string is also costly - that's why I created str_view project. But std::vector is just a wrapper over a dynamically allocated array that also remembers its size and can reallocate when you add new elements. Without STL, you would need to implement the same functionality yourself.
When it comes to traversing elements of the vector (e.g. to sum the numerical values contained in it), there are many ways to do it. STL is notoriously known for working very slow in Debug project configuration, but as it turns out, this heavily depends on what method do you choose for using it.
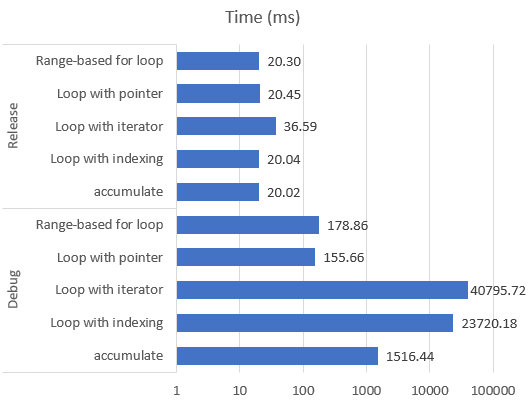
Here is a small experiment that I've just made. In this code, I create a vector of 100,000,000 integers, then sum its elements using 5 different methods, calculating how much time does it take for each of them. Results (averaged over 5 iterations for each method) are as follows. Notice logarithmic scale on horizontal axis.
Here is the full source code of my testing program:
#include <cstdio>
#include <cstdint>
#include <vector>
#include <chrono>
#include <numeric>

typedef std::chrono::high_resolution_clock::time_point time_point;
typedef std::chrono::high_resolution_clock::duration duration;
inline time_point now() { return std::chrono::high_resolution_clock::now(); }
inline double durationToMilliseconds(duration d) { return std::chrono::duration<double, std::milli>(d).count(); }

int main()
{
    printf("Iteration,Method,Sum,Time (ms)\n");

    for(uint32_t iter = 0; iter < 5; ++iter)
    {
        std::vector<int> numbers(100000000ull);
        numbers[0] = 1; numbers[1] = 2; numbers.back() = 3;

        {
            time_point timeBeg = now();

            // Method 1: Use STL algorithm std::accumulate.
            int sum = std::accumulate(numbers.begin(), numbers.end(), 0);

            printf("%u,accumulate,%i,%g\n", iter, sum, durationToMilliseconds(now() - timeBeg));
        }

        {
            time_point timeBeg = now();

            // Method 2: Use the new C++11 range-based for loop.
            int sum = 0;
            for(auto value : numbers)
                sum += value;

            printf("%u,Range-based for loop,%i,%g\n", iter, sum, durationToMilliseconds(now() - timeBeg));
        }

        {
            time_point timeBeg = now();

            // Method 3: Use traditional loop, traverse vector using its iterator.
            int sum = 0;
            for(auto it = numbers.begin(); it != numbers.end(); ++it)
                sum += *it;

            printf("%u,Loop with iterator,%i,%g\n", iter, sum, durationToMilliseconds(now() - timeBeg));
        }

        {
            time_point timeBeg = now();

            // Method 4: Use traditional loop, traverse using index.
            int sum = 0;
            for(size_t i = 0; i < numbers.size(); ++i)
                sum += numbers[i];

            printf("%u,Loop with indexing,%i,%g\n", iter, sum, durationToMilliseconds(now() - timeBeg));
        }

        {
            time_point timeBeg = now();

            // Method 5: Get pointer to raw array and its size, then use a loop to traverse it.
            int sum = 0;
            int* dataPtr = numbers.data();
            size_t count = numbers.size();
            for(size_t i = 0; i < count; ++i)
                sum += dataPtr[i];

            printf("%u,Loop with pointer,%i,%g\n", iter, sum, durationToMilliseconds(now() - timeBeg));
        }
    }
}
As you can see, some methods are slower than the others in Debug configurations by more than 3 orders of magnitude! The difference is so big that if you write your program or game like this, it may not be possible to use its Debug version with any reasonably-sized input data. But if you look at disassembly, it should be no surprise. For example, method 4 calls vector methods size() and operator[] in every iteration of the loop. We know that in Debug configuration functions are not inilined and optimized, so these are real function calls:

On the other hand, method 5 that operates on raw pointer to the vector's underlying data is not that much slower in Debug configuration comparing to Release. Disassembly from Debug version:

So my conclusion is: Using std::vector to handle memory management and reallocation and using raw pointer to access its data is the best way to go.
My testing environment was:
CPU: Intel Core i7-6700K 4.00 GHz
RAM: DDR4, Dual-Channel, current memory clock 1066 MHz
OS: Windows 10 Version 1803 (OS Build 17134.285)
Compiler: Microsoft Visual Studio Community 2017 Version 15.4.8
Configuration options: x64 Debug/Release
Windows SDK Version 10.0.16299.0
Update 2023-09-30: There is a follow-up article that you may find interesting: "3 Ways to Iterate Over std::vector".
Comments | #optimization #c++ #stl Share
# Rendering Optimization - My Talk at Warsaw University of Technology
Tue
12
Dec 2017
If you happen to be in Warsaw tomorrow (2017-12-13), I'd like to invite you to my talk at Warsaw University of Technology. On the weekly meeting of Polygon group, this time the first talk will be about about artificial intelligence in action games (by Kacpi), followed by mine about rendering optimization. It will be technical, but I think it should be quite easy to understand. I won't show a single line of code. I will just give some tips for getting good performance when rendering 3D graphics on modern GPUs. I will also show some tools that can help with performance profiling. It will be all in Polish. The event starts at 7 p.m. Entrance is free. See also Facebook event. Traditionally after the talks we all go for a beer :)
Comments | #teaching #graphics #gpu #optimization Share
Pages: 1 2 ![]()